How much cover crops cost to implement and whether they can make you money is a subject of heated debate. Costs are obvious: seed, time and fuel to plant and terminate them. The benefits tend to be less tangible and slower to accumulate: cover crops stabilize yields, but don’t necessarily increase them, and sometimes they lead to lower nutrient or herbicide applications over time. They’ll also definitely slow erosion and nutrient loss, but unless you’re spending money each year on eliminating ruts and putting in grass waterways, those savings can be hard to see.
A new spreadsheet tool developed by Katie Wilts Johnson, the MN Office for Soil Health, and the Center for Farm Financial Management lets growers and advisors play around with different scenarios to see what’s profitable over one, five and ten year periods. Plant the cover crop yourself instead of hiring an operator? Big boost. Planning on a burndown spray anyway? The cost of cover crop implementation goes down. The spreadsheet relies heavily on survey data from SARE's analysis of the economics of cover crops, as well as a survey Johnson did on cover crop costs in Minnesota, and FINBIN data for expected yields by county.
One really critical piece of the profit picture is how much cost-share growers are able to use. If growers get $30/ac for one year, they can cover costs and be profitable that first year, but it may not cover costs in the long term. If that cost share extends over three years, it gets growers past the learning curve. Since a slight yield boost is expected after three years (based on the SARE survey), the spreadsheet suggests that if you get at least three years of cost share, you can likely be profitable over the 5- and 10-year timescale.
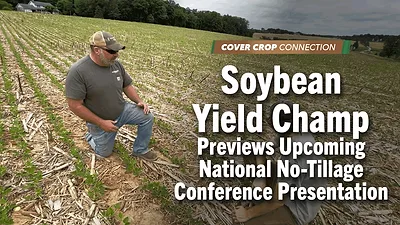
Soybean Yield Champ Previews Upcoming National No-Tillage Conference Presentation
A few weeks ago I visited my home state of Maryland and had the chance to chat with Finksburg, Md., no-tiller and soybean yield champ Chris Weaver. Check out this clip as he introduces himself and his farm while giving you a sneak peak of his upcoming presentation at the 35th annual National No-Tillage Conference in Indianapolis this coming winter.