The benefits of planting cover crop mixtures include the potential for additional nutrients to the subsequent cash crop, improved livestock feed and improved soil health, among other benefits. Farmers adopting multispecies cover crops are also interested in learning about the yield response of the crop planted following a cover crop. An experiment in Tennessee found that after 3 years using a multispecies cover crop mixture, soybean yield increased by 13% (68 bu/ac) in comparison with low-diverse cover crops and a no-cover treatment (Chu et al., 2017). Other analyses of research from the United States and Canada have found that cover crop mixtures can increase corn yield by 30% more than grass cover crop species alone (Marcillo and Miguez 2017). Studies have also found that cover crops can adversely affect crop yields, but the mechanics explaining yield penalties are often uncertain or inconsistent (Eckert, 2013; Kaspar et al., 2015). Thus, appropriately constructed mixtures may increase opportunities to gain the soil health benefits and result in positive, neutral, or negative effects on yield. As a result, there is growing interest in using cover crop mixtures and understand their overall contribution to the cropping system. Through education and on-farm assessment, Nebraska landowners part of the Soil Health Initiative (SHI) are evaluating the effects of diverse cover crop mixtures on both soil properties and agronomic indicators of soil health.
Remote Sensing as a “Visual Diary” of the Growing Season
Farmers in the Nebraska SHI are exploring tools and features to evaluate crop performance and crop health insights. End-of-season yield, the ultimate metric to evaluate crop performance, does not tell farmers the full story of how the cash crop performed throughout the growing season. Remote sensing techniques can be used to provide farmers a “visual diary” of their season and document how crop and soil responded to weather, pests, or diseases during the growing season as a results of management decisions such as cover crops. Such information can be used as a tool for in-season decisions (for example, water and nutrient application), as well as management plans for the following year.
This report focuses on lessons learned from one of the on-farm demonstration fields established as part of the Nebraska SHI located in Howard County. The 96-acre field is in a corn-soybean-small grain rotation and became part of the initiative in 2017. The study compared the use of a cover crop mixture versus no-cover crop in randomized and replicated field-length strips. The cover crop mixture drilled in September 2018 (the second year of continuous cover crop use) comprised of a 9-species mixture recommendation based on NRCS cover crop guide. On May 10th, 2019 cover crop aboveground biomass was collected before chemical termination on May 14th, 2019. Total biomass for cover crop was 1.25 ton/ac or 2500 lb/ac. After cover crop termination, soybean was planted on May 16th, 2019 at a 30-inch row spacing. Additional information about the site management can be found in the 2019 SHI on-farm research report. High-resolution imagery (including natural color, infrared, and thermal) were acquired on a weekly basis during the soybean growing season from TerrAvion.
Deciphering Yield Results Through NDVI and Thermal Imagery
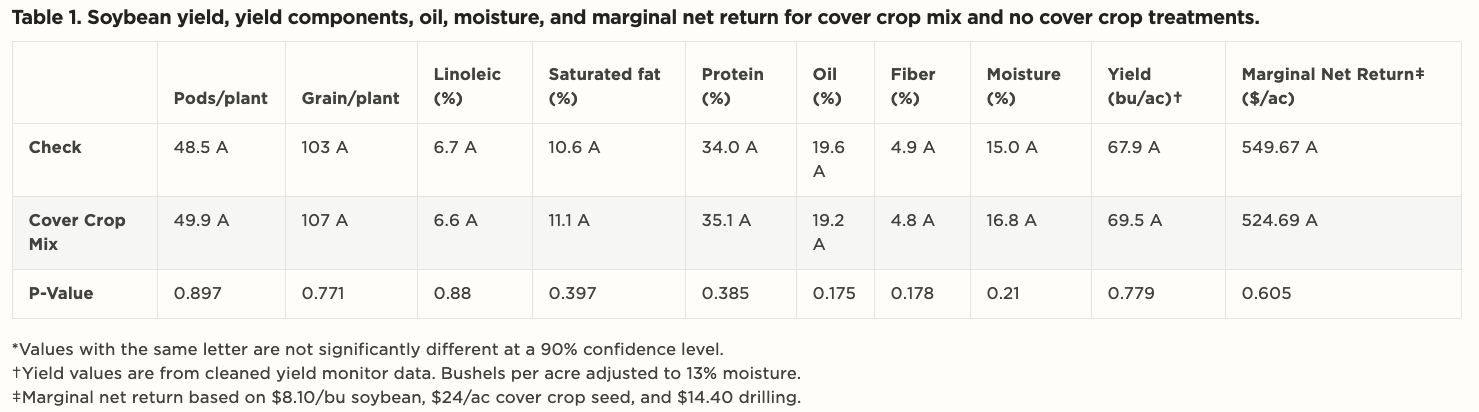
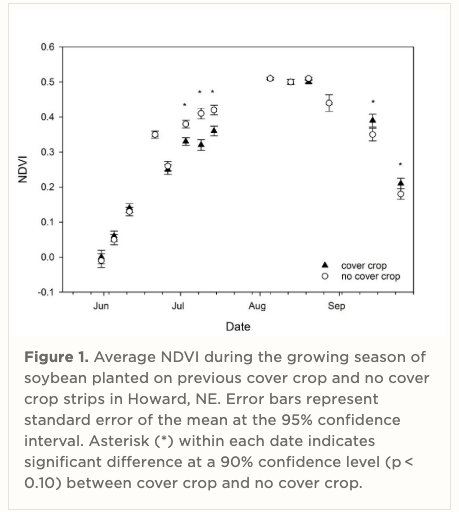
The soybean grain moisture, yield, quality, and net return were not different following the cover crop versus no cover crop (Table 1). To determine how the cover crop mixture impacted soybean crop growth, we analyzed the normalized difference vegetation index (NDVI) from the growing season imagery. The NDVI, a ratio of red to near-infrared light, is a metric derived from plant canopy spectral reflectance that gives a quantitative estimation of vegetation growth and biomass. The index varies between 0 and 1 with very low NDVI values representing areas of bare soil and high NDVI values corresponding to dense vegetation. Thus, NDVI data correlates to plant vigor, and differences in vigor on a field can show the effect of varying management, such as cover crops. For this field, the NDVI data showed lower values for soybean in strips that followed cover crops in July, and higher NDVI values in September (Figure 1).
 Despite the lack of soybean yield and grain quality differences, how do we explain the vigor differences as shown by NDVI developed throughout the season? By looking at NDVI and other indices patterns developed in the soybean crop development cycle, we can make inferences about crop health and some attributes such as photosynthetic capabilities and canopy nitrogen and water status (Braga et al., 2020; Guo et al., 2017; Mercante et al., 2011). Here, we found that NDVI values were higher in the no cover crop treatment soybean during July, but by the end of the growing season the NDVI values were higher in the soybean following the cover crop treatment.
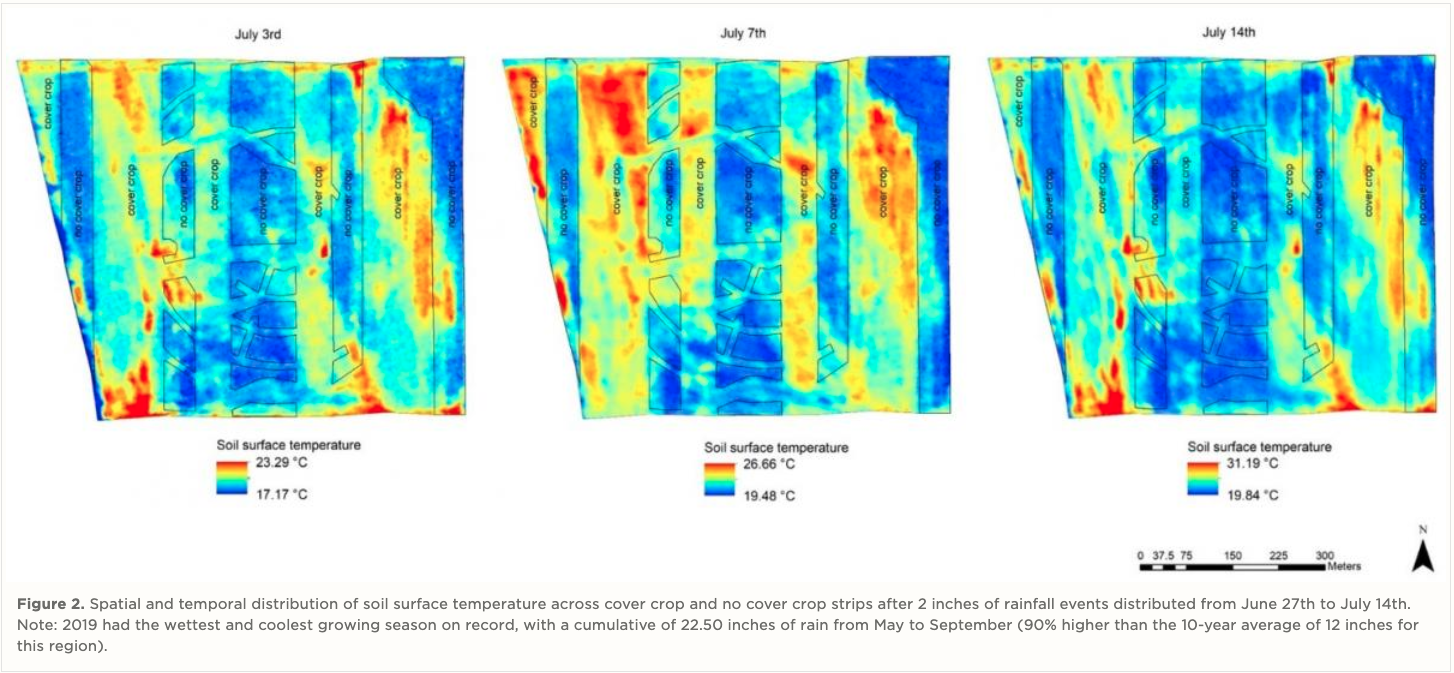
 Our next step was to look at the thermal imagery to try to better understand the potential impact of the cover crop during the soybean growing season. Thermal patterns may develop in a field during the early and middle parts of the season, particularly around the time of heavy precipitations or drought conditions in rainfed systems. Plant vigor may be correlated with thermal patterns. In general, low vigor that corresponds to warmer thermal patterns can mean water stress due to varied reasons such as poor soil quality, drought, inadequate irrigation, to name a few. Thermal imagery can show plant water stress, through the canopy temperature measurements. Water stress induces stomatal closure in plants to prevent transpiration and the loss of water. As a result, drought soil conditions lead to higher canopy temperatures. Also, plants with higher canopy temperatures have more visible wilting symptoms that indicate high correlations between wilting scores and NDVI.
We observed that the reduced early season soybean vigor following the cover crop mixture (lower NDVI values in July) was also associated with higher canopy temperature patterns in the field (Figure 2). We then wondered: what is happening in this field? As observed in previous studies, both NDVI and thermal imagery can be useful for detecting changes in soybean canopy development and senescence because they utilize the differences between soil and foliage reflectance in the near-infrared and visible portions of the spectrum (Gray et al., 2010; Penuelas and Filella, 1998). Our field assessments revealed that soybean plants were not as large nor canopied as soybeans following no cover crop in July. In September, soybeans following cover crops had higher NDVI representing soybean which were not as mature. Soybeans following the no cover crop treatments had greater leaf senescence and were more mature. Thus canopy senescence was delayed by cover crop. Answering the question stated - one possible explanation for what happened in this field was soybean rows completely covered in the no cover crop treatment and temporarily drier soil conditions (soil exposed to heat and evaporation) in the cover crop treatment in July. In spite of these visual differences, noted both visually and with imagery, the end of season yield numbers showed the same values in soybean following the cover crop mixture (approximately 50 bu/ac) compared to no cover crop (approximately 49 bu/ac) (Table 1).
Continued Effort to Detect Cover Cropping Effects on Cash Crop Growth and Development
In order to better understand the differences observed in the 2019 aerial imagery and how cover crop management impacts water availability and cash crop yield and quality, ground-based measurements will be obtained for the remainder of the project. The goal is to better understand the spatial-temporal variability of soil and crop performance as affected by cover crop use. Combining aerial imagery with ground-based measurements may provide opportunities to better manage cover crops to maximize soil health benefits while protecting cash crop yields.