By John Dobberstein, Senior Editor
A preliminary analysis of data released from the 2017 Census of Agriculture shows cover crop acreage in the U.S. has grown by more than 8% per year since 2012 and major Corn Belt states appear to be leading the charge.
The Census found 15.4 million acres of cover crops were seeded when the Census was taken, a 49% increase over 2012, according to a preliminary national report on the data submitted by Rob Myers, regional director of extension programs for Sustainable Agriculture Research and Education (SARE).
Corn Belt Acres Booming
Texas topped the list of state acreage with 1,014,145 acres, but that figure only increased 11.3% in 5 years. Iowa, Indiana, Missouri, Nebraska, Ohio, Illinois, Michigan, Wisconsin and Pennsylvania rounded the top 10 states on total cover crop acres (Table 1, Figure 1).
But in terms of growth rates, Iowa’s 156% increase in cover crop acres led the nation, with 973,112 acres seeded in 2017 vs. 379,614 in 2012, Illinois, Ohio, Nebraska and Missouri also led the way with increases of 100% or more, Myers says.
Cover crop adoption increased much faster in the Midwest than elsewhere, with a 79.1% increase in the Midwest from 2012 to 2017 versus 49.7% nationally. But the Midwest continues to lag well behind several of the Eastern and Southeastern states in terms of the percent of cropland planted with cover crops (Figure 2).
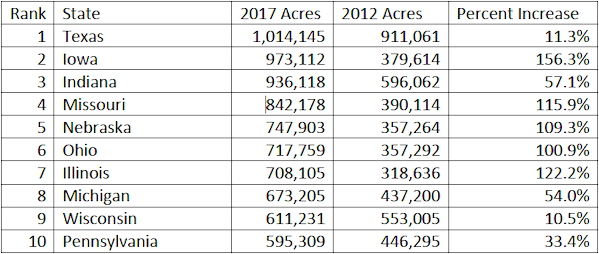
Table 1. Planted cover crop acres reported in the Census of Agriculture for 2017 and 2012, ranked by the 2017 acreage and showing percent increase for 2017 over 2012. (Source: SARE)
“The top figures in the Midwest for percent of cover crop adoption in relation to commodity acres were only in the ballpark of 10%, whereas 10 states outside the Midwest had cover crop adoption equivalent to 20% or more of their corn, soybean, and/or cotton acres,” Myers says. “In fact, 6 states had cover crop adoption exceeding a 35% equivalent of their corn, soybean, and/or cotton acres.
40 Million Acres by 2029?
Here are some other observation from Myers about the Census data:
• “The overall increase of cover crop acreage from 2012 to 2017 is 49.7%. That works out to an annual growth rate of about 8.4% compounded annually,” he notes. “If we kept on that exact growth rate we’d get to 19.6 million acres in 2020, hit 25 million acres in 2023, and 40 million acres in 2029. I actually believe we could beat that projected growth rate. For evidence, I’d point to several of the big Corn Belt states that more than doubled their cover crop acres in the last 5 years."
• More analysis is needed to determine how accurate the Census reporting of cover crop acres is, Myers says. Although he believes it’s the most complete set of numbers available for U.S. cover crop acreage, in some of the states where cover crop acres have been tracked closely the Census numbers “are a little on the low side,” by comparison, he says. For example, a detailed Indiana transect reported 970,000 acres of covers vs. 936,118 acres in the Census.
“An even bigger disparity is in Maryland, where the Maryland Department of Agriculture routinely reports over 500,000 acres vs. 410,849 by the Census,” Myer says. “I’d attribute part of this to a lack of explanation in the Census for what a cover crop is. The Census simply asks ‘How many acres of cover crops did you plant?’ without defining what should be counted as a cover crop.”
He adds that some farmers have also been cautious about reporting cover crop acres for fear of it affecting their crop insurance eligibility. Myer says cover crop use doesn’t prevent farmers from getting cover crops, “but it’s a misperception that’s out there.”
• “People often comment that ‘I don’t see many cover crops in my area.’ But this data really struck me just how widespread cover crop use is across the country, even in many of the drier western states,” Myers says. “However, it’s true that national cover crop acreage is still well below where most of us would like it to be.
“There were 320 million acres of “cropland” reported in the 2017 Census of Agriculture. If you take out land used for hay production, that leaves 263 million acres of non-hay crops, most of which in theory could have a cover crop associated with them (winter cereals, however, are by their nature not used with winter annual cover crops).
“Even if about 33 million acres of winter wheat is removed from the baseline of cropland that could be cover cropped, leaving 230 million acres, the 15.4 million acres of cover crops represents only 6.7% of that 230 million acres. On the positive side, we are making progress.
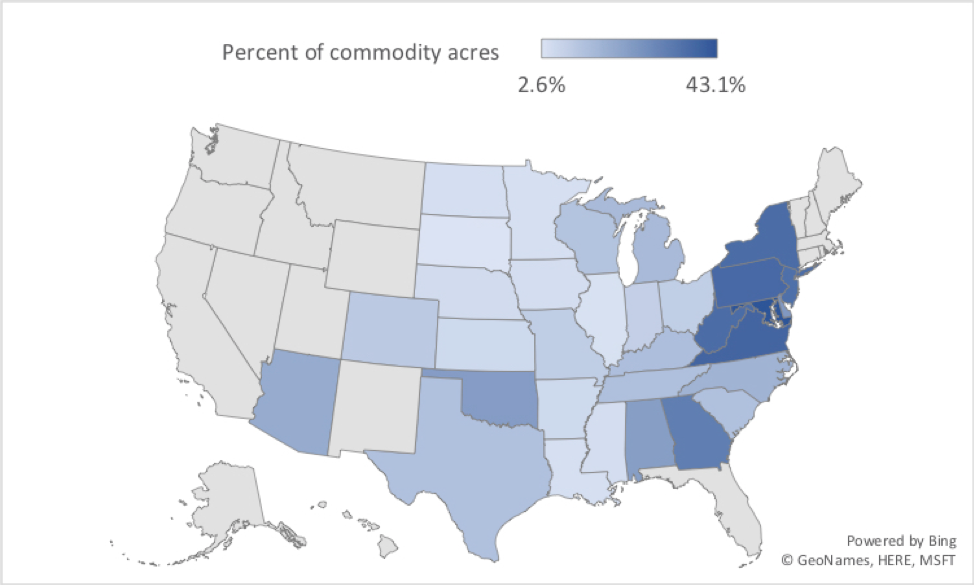
Figure 2. Map shows percent of corn, soybean and cotton acres planted to cover crops in 2017 based on Census of Agriculture 2017 data. Note that only states with significant acreage of those three commodities were plotted. It’s also important to note that in most of these states, cover crops are likely planted on some fields that have crops other than corn, soybeans, or cotton, such as small grains, sorghum, vegetables, vineyards, orchards, or other crops. (Source: SARE)
“Ten states have cover crop acreage equivalent to 20% or more of their corn, soybean, and cotton acreage (arguably the three biggest commodities used with covers), and 6 states have the equivalent of over 35% of the acreage of that commodity area planted in cover crops (some caution is called for in using these calculations due to use of cover crops with other cash crops in those states, but in most of the relevant states, that other cash crop acreage would be minor).
“Bottom line, it is feasible to get cover crops on a third or more of commodity cropland.
• Myers says it’s notable that some states more than doubled their cover crop acreage and others had only minor changes in cover crop use in 5 years. “I hope to do some further analysis of why this is the case.
Probably multiple factors are involved, including cropping systems, extent of education and cover crop incentive programs, and other factors,” he says. “I also found it interesting that percent change in number of farm operations using cover crops did not appear to be highly correlated with percent change in cover crop acreage.
“Overall, growth in acreage (49.7%) exceeded the growth in number of farm operations using cover crops (15.2%). This indicates that farmers using cover crops in 2012 were increasing their acreage of cover crops even faster than new farms were starting to adopt them, a trend that fits with SARE/CTIC survey data.”
Resources
** Census of Agriculture data can be found at https://www.nass.usda.gov/AgCensus/
** The SARE/CTIC survey data for 5 years of national surveys can be found at https://www.sare.org/Learning-Center/Topic-Rooms/Cover-Crops/Cover-Crop-Surveys.