Takeaways
- Cover crop adoption across the U.S. might be making more progress than we realize.
- Larger farms are boosting cover crop acreage around the nation at a much higher rate than smaller farms.
- There is always still work to do and more to be done to help get more cover crops on farms across the U.S.
Cover crop adoption rates continue to be a hot topic among growers and researchers alike. Earlier this week I attended the Midwest Cover Crop Council meeting in Dubuque, Iowa and on several different occasions I heard the same question asked — how do we get more farmers to plant cover crops?
This question was asked by an attendee to a farmer panel, it was asked a few times in networking conversations in the hallways and it was asked by me in a blog back in late December.
And while there is no definitively correct answer, I did receive a well thought out reply from cover crop expert and director for University of Missouri's Center for Regenerative Agriculture Rob Myers. Here is his take on where we currently stand in terms of cover crop adoption and how we might continue to "grow the game," so to speak.
I want to go straight to the USDA Census of Agriculture data from 2022 and point out that adoption trends are better than they might seem at first glance.
Some people like to say that out of all the cropland in the U.S., only a small percent has a cover crop planted on it. This is somewhat true, but they fail to note some key points that are only evident from a deeper examination of the Census data.
1) The number of farmers who have at least some cover crops is actually pretty good, with 153,328 farm operations reporting that they had cover crops on at least some fields in 2022. This is out of about 1.2 million farms that harvested crops that year, so over 12% of crop farms reported having cover crops. Keep in mind that many do not plant their whole farm to cover crops, for a variety of reasons, including crop rotation, time to get the seeding done, expense, etc. (see slide #1 below)
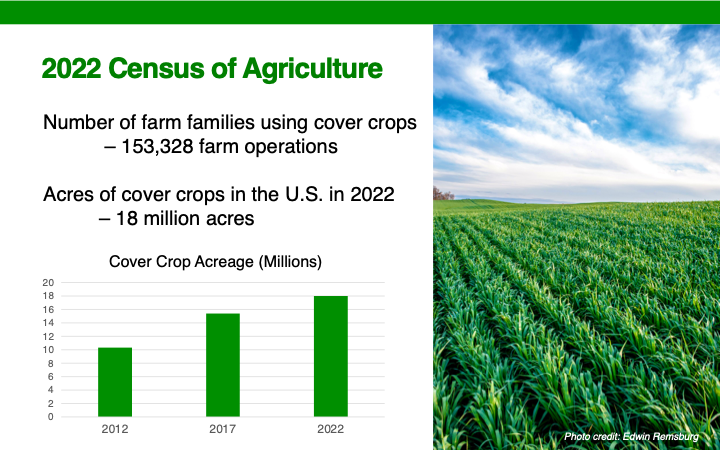
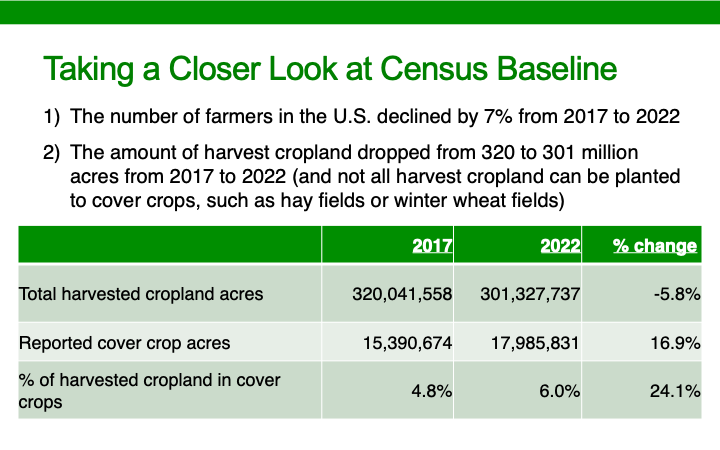
2) Just looking at the straight increase in cover crops from 15.4 million acres in 2017 to 18 million acres in 2022 shows a modest 17% increase in acreage. But it’s important to look at what happened with harvested cropland, which dropped from 320 million acres in 2017 to 301 million acres in 2022, meaning that the percent of harvest cropland in 2022 planted to cover crops actually increased by 24% rather than the more commonly cited 17%. (see slide #2 below)
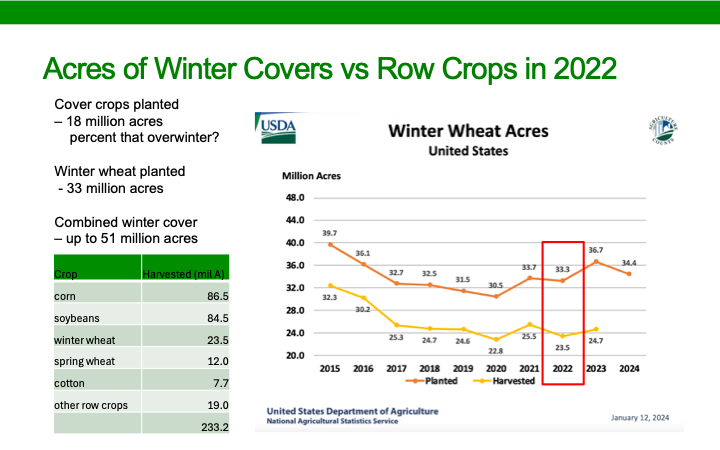
3) Sticking with the theme of what could have been planted to cover crops, a lot of people forget to factor in winter wheat acres. In 2022, there were 33 million acres of wheat planted that fall according to the Census of Agriculture. While we don’t know exactly how many of the 18 million acres of cover crops were over-wintering cover crops, an educated guess is that it was 80-90% of those cover crops. So adding the 33 million acres of winter wheat with about 15-16 million acres of over-wintering cover crops means farmers provided about 48-49 million acres of fields with something that provided green living cover. And of course that doesn’t include CRP or hay crops, which adds tens of millions of acres of additional winter cover. We still have way too many fields without winter cover, but it is not the 95% some people mistakenly cite. (see slide #3 below)
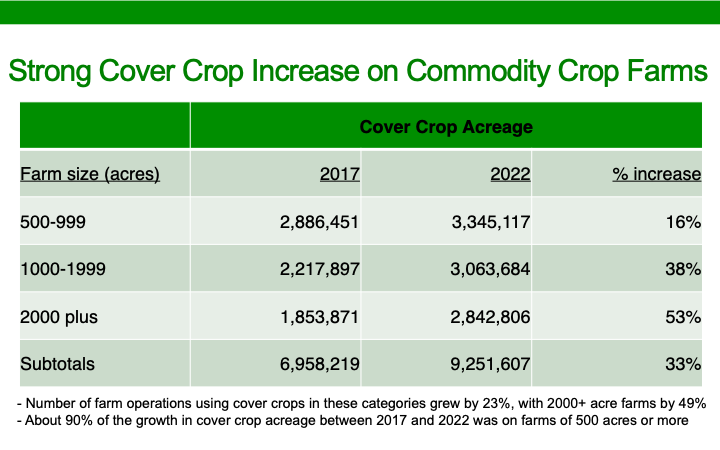
4) According to the Census data, larger farms boosted cover crop acreage by MUCH more than smaller farms. Farms that had 1000-1999 acres of cropland boosted cover crop use by 38%, while farms of 2000 acres or more boosted cover crop use by a whopping 53%. I would suggest that future growth of cover crop acreage will continue to be driven primarily by larger farms, so the strong adoption trend there is very good to see. (see slide #4 below)
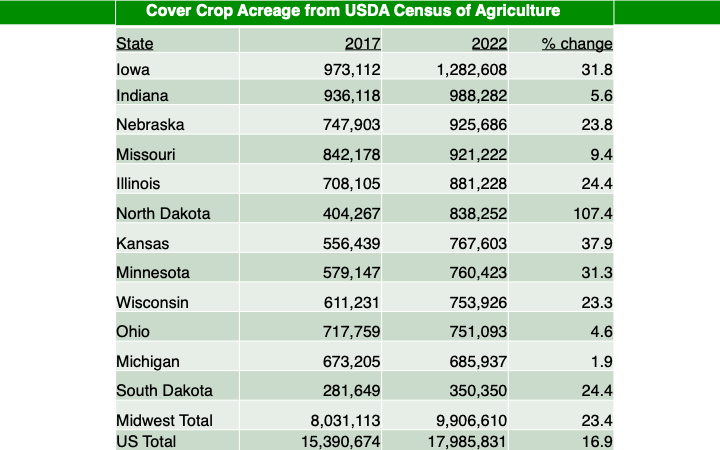
5) Looking solely at national numbers obscures the rapid growth in cover crops that has occurred in many areas. For example, what most people consider the American breadbasket, in other words the 12 Midwestern states listed in slide #5 below, had cover crop acreage grow by 23% versus the 17% nationally. Even more notably, several states had big jumps in cover crop acreage. Iowa cover crop acreage grew by 31%. Minnesota and North Dakota, often claimed to be too far north for cover crops, grew by 31% and 107% respectively (yes, that’s right, North Dakota farmers more than doubled cover crop acres). Kansas, which some would assume is too dry for cover crops had 38% growth. There were other states where growth was more modest, I think most often because of dry weather that fall – I know that was a big factor that limited cover crop planting in Missouri in the fall of 2022.
I didn’t break out cover crop acreage by county here, but I know from looking at that data that there are many individual counties that have over 30% of available cropland planted to cover crops and some counties have 50% or more of their cropland planted to cover crops. To me that indicates what’s possible in other areas as more and more farmers get comfortable with cover crops.
To be sure, it’s not all sunshine and roses, there is still resistance due to things like time to plant the cover crop, cost of seed, individual farmers uncertainty about how cash crops will be affected and other factors. However, the closer look at the Census data I am sharing here illustrates that significant progress is being made with cover crops in many areas of the U.S., and I expect that to continue.
Related Content:
The Disappointingly Slow Adoption Rate of Cover Crops — What Gives?
[Podcast] 4 Alternative Cover Crops to Try on Your Farm with Rob Myers
Breaking Down the Benefits of Seeding Cover Crops in Early Spring