
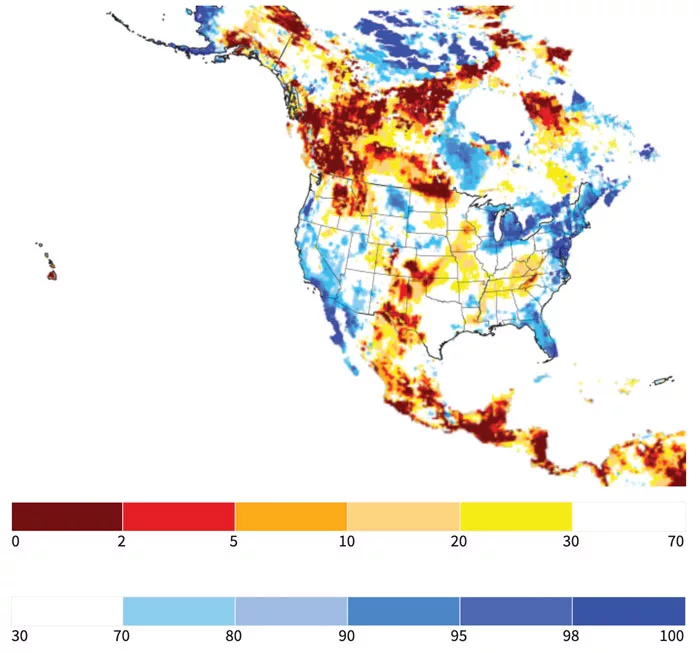
This soil moisture map portrays the moisture of the top 1 meter of soil as of April 2, 2024, expressed as a percentile showing the probability of occurrence within the period of record between 1948 to present. The map is based on terrestrial water storage observations derived from NASA GRACE satellite data using a sophisticated model of land surface water and energy processes. Red and orange hues indicate drier soil moisture conditions, while blue hues indicate wetter conditions. NASA, National Drought Mitigation Center
Deeper Roots, Surface Residue from Cover Crops Battle Drought
With proper termination timing, cover crops benefit cash crops during dry years
Drought continues to be a concern for many growers especially for much of the midwest and southern United States, as is depicted in the soil moisture conditions map. Cover crops can be a valuable tool for conserving moisture during drought, but cover crop management strategies are important when attempting to conserve soil moisture. Adjusting termination timing by even a few days, for example, could make a major difference in total moisture content, according to Rob…

The National No-Tillage Conference returns January 12-15, 2027! Build and refine your no-till system with dozens of new ideas and connections at the 35th Annual National No-Tillage Conference in Indianapolis, Jan. 12-15, 2027. Experience an energizing 4-day agenda featuring inspiring general session speakers, expert-led No-Till Classrooms and collaborative No-Till Roundtables. Plus, Certified Crop Adviser credits will be offered.
Learn MoreTop Articles
Current Issue
Must Read Free Eguides
Download these helpful knowledge building tools
View MoreVideos

Live from FIRA: New Tech Fights Herbicide Resistant Weeds
I'm in Yakima, Washington this week at FIRA USA where there's always lots of great ag technology on display. Why don't we go take a look at the newest edition of the Aigen robot. We'll hear from Kenny Lee, the CEO of Aigen.