The National No-Tillage Conference returns January 12-15, 2027! Build and refine your no-till system with dozens of new ideas and connections at the 35th Annual National No-Tillage Conference in Indianapolis, Jan. 12-15, 2027. Experience an energizing 4-day agenda featuring inspiring general session speakers, expert-led No-Till Classrooms and collaborative No-Till Roundtables. Plus, Certified Crop Adviser credits will be offered.
Learn MoreDownload these helpful knowledge building tools
View More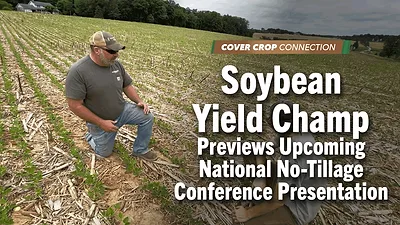
A few weeks ago I visited my home state of Maryland and had the chance to chat with Finksburg, Md., no-tiller and soybean yield champ Chris Weaver. Check out this clip as he introduces himself and his farm while giving you a sneak peak of his upcoming presentation at the 35th annual National No-Tillage Conference in Indianapolis this coming winter.

Family Owned since 1964 – Remlinger Manufacturing was founded by Wilbur Remlinger in 1964 and the family tradition continues today with Wilbur’s grandson being the current CEO/President. Although the business has expanded and diversified, family remains a core value to the company and is evident in the company culture.
Made in USA – Remlinger Manufacturing is proudly located in Kalida, Ohio. We have dealers located across the US and Canada to conveniently serve our customers.
Quality Driven – With over 60 years of producing farm equipment, we continue our tradition of manufacturing high quality attachments and products to serve farmers around the globe.

Our years of experience and network of dealers make us the ideal choice for your mowing, no-till and horse drawn equipment needs. Use our Dealer Locator to contact your nearest I&J dealer today.